
Monday, November 22, 2010
CS Odessa Ranks in Software Magazine’s 28th Annual World Software 500 for Second Time
Press release on CS Odessa making Software 500 for second year in a row.
Friday, November 19, 2010
Take our brief survey to see if you qualify for ConceptDraw Office 2 preview
Coming soon will be the new version of ConceptDraw Office 2. We have a brief survey for people who want to qualify for a preview. Launch date for ConceptDraw Office 2 has not been announced as of November 19, 2010.
Wednesday, November 3, 2010
Now you can access ConceptDraw MINDMAP Files on your iPhone

CMS has released a new version of their mind mapping product for the iPhone. The iThoughts version 4.0 now supports the import of ConceptDraw MINDMAP 6 files. Version 4 of iThoughts for the iPhone can be purchased on iTunes for only $7.99. For a very small price you can carry your map information with you. Link to iThoughts
Download a copy of any of the ConceptDraw products from here. http://www.conceptdraw.com/
Monday, September 27, 2010
Why Our Customers Buy ConceptDraw Products

I would like to share with you the results of one of those questions. The question is a fill in the blank question. “I feel that the ConceptDraw product I purchased has____.”
Of all of the responses we got to that question, the four most common responses were:
-“more features than the competition” (11 responses)
-“better user experience than the competition” (10 responses)
-“better price than the competition” (5 responses)
-“higher price but more features than the competition” (2 responses)
One person commented that their ConceptDraw product has “Better Mac/Windows compatibility”.
These are just a few recent examples of why people have decided that we are the right solution for them. Call us to find out how we can be the right solution for you.
Concept Mapping Toyota’s 8-Step Lean Manufacturing Methodology

Lean Manufacturing is a core fundamental for businesses that focus on delivering a quality product to their customers, while minimizing production waste. Toyota has a variant of this called the 8-Step Process that is very popular because of its ease of implementation and success in the improvement of an existing process. The 8-Step methodology is a business philosophy that is a proven way to solve simple to complex issues that often vex companies.
The first of the 8 steps is to identify the problem by using quantifiable terms to describe the current situation. What is the problem, in what process is the problem occurring, who is involved with that process, at what point in that process is the problem occurring, , is the cause of the problem known, and what is the relative magnitude of the problem? It is important to have physical evidence of the issue, if possible. Many people will use a physical sample, photos and even drawings to describe the problem’s nature. This step of obtaining the evidence will often eliminate any false alarms that might cause an unnecessary effort.
The second step is to break down the problem. Is the problem universal, does it occur in only one plant, and does it occur on only one machine? If the problem is occurring in the field, do you have a process in place that allows you to track failures back to the process that produced the part or assembly. When a problem does occur, it is imperative that there be a path available to track from the incident to the inception.

Now that you have identified the problem, it is important to set a target. Once you have gone through the process, what is the ideal or planned outcome? This third step establishes the performance baseline and the end goal. These are two very important elements to this problem solving process.
The forth step is to find the source. What causes the problem? It is important to review the process being investigated and the current controls. Questions that can be asked are ‘What has changed?’ or ‘What anticipated event did not occur?’ If the answer is not clear, then a systemic issue exists and additional physical analysis is necessary to determine root cause. Discovery of the root cause must be accomplished to progress to any other steps.
Now we get to the problem resolution stage. In step 5 we implement corrective actions, the team defines and implements the best corrective action, and ongoing controls are implemented to make sure that the root cause has been eliminated. Once changes have been put into production, it is important to monitor the long-term effects that have been put in place. And of course, all changes implemented must be documented—the appropriate control plan, process flow documentation, and appropriate work instructions.
In step 6, it is necessary to verify that the selected corrective actions will resolve the problem and that the changes will not cause any undesirable side effects to occur.
Step 7 is the evaluation of the modified process and its results. This is a good time to look at the issue and the identified solution in its entirety. What can be learned from this important step that will have potentially a universal impact on how your business is conducted?
The final step is to standardize successful processes to build quality in to the product and to resolve any future shortcomings in the manufacturing process. Quality has such a demonstrable impact on customer buying patterns today that methodologies such as Toyota’s 8-step problem solving have been widely adopted many manufacturing organizations and the United States Air Force.
Click here to download a template for the 8-step problem solving solution.
Tuesday, August 31, 2010
Mindmapping for writers
If you're interested in learning more about how to use mind mapping as a tool for writing, check out my 3-part series. It can be found at:
1. The Writerly Life: Mind Mapping for Writers: If you're more artist than engineer, this approach is for you.
2. Nick Daws' Writing Blog: Mind Mapping for Writers: If you're more artist than engineer, this approach is for you.
The series takes you from brainstorming and organizing ideas to progressing from ideas in a map to words on a page.
Wednesday, August 11, 2010
How To Create A Visual Event Calendar Using ConceptDraw Office
Step 1. Create the events you are planning as a mind map using ConceptDraw MINDMAP.

Step 2. Select all topics by pressing Ctrl+A and then copy the map.

Step 3. Open ConceptDraw PRO and create a new document using the Calendar template from the Template Gallery. The Calendar template is located inside the Project Management category of the Template Gallery.

Step 4. Press Ctrl+V to paste the copied mind map information into the ConceptDraw PRO document workspace.

Step 5. Next drag and drop calendar shapes from the Calendars library to the document workspace for each topic of the mind map.

Step 6. To set the required date click on the date you want to identify and then change the font attributes for that date (color, size, type style). To navigate to a different date use the Action button menu to change months and years that are presented.

Step 7. Connect the mind map topics to the calendars using the Smart Connector tool located in the ConceptDraw PRO toolbar.

Result. The finished product is now an excellent visual plan of your important activities in the visual format of mind map.

Post Script: Of course it is also possible to use ConceptDraw PRO to build a date calendar and then use that visual information in a ConceptDraw MINDMAP topic. Our ConceptDraw products have the flexibility to work the way you want to work.

You can find out much more about our products here on our blog, or visit our web site for detailed information on each of our products. You are able to download a no obligation 30-day trial copy from this web page.


Step 2. Select all topics by pressing Ctrl+A and then copy the map.

Step 3. Open ConceptDraw PRO and create a new document using the Calendar template from the Template Gallery. The Calendar template is located inside the Project Management category of the Template Gallery.

Step 4. Press Ctrl+V to paste the copied mind map information into the ConceptDraw PRO document workspace.

Step 5. Next drag and drop calendar shapes from the Calendars library to the document workspace for each topic of the mind map.

Step 6. To set the required date click on the date you want to identify and then change the font attributes for that date (color, size, type style). To navigate to a different date use the Action button menu to change months and years that are presented.

Step 7. Connect the mind map topics to the calendars using the Smart Connector tool located in the ConceptDraw PRO toolbar.

Result. The finished product is now an excellent visual plan of your important activities in the visual format of mind map.

Post Script: Of course it is also possible to use ConceptDraw PRO to build a date calendar and then use that visual information in a ConceptDraw MINDMAP topic. Our ConceptDraw products have the flexibility to work the way you want to work.


Tuesday, July 6, 2010
Create a Prioritization Matrix with ConceptDraw PRO
Step 1. From ConceptDraw PRO, open the “Prioritization Matrix” template.

Tip: Press F2 to start/stop Text Editing mode.
Step 2. Complete the table according to your known issues and criteria.

Step 3. To add or remove rows and columns, use click the button in the upper right corner of each cell, row, or column. Select your desired action from the menu.

Step 4. Rate and total all criteria points for each issue. Add the total amounts in the Total column.

Result. An easy to use chart to prioritize issues.
Thursday, July 1, 2010
Managing Quality with a Prioritization Matrix
A Prioritization Matrix is a useful technique you can use with your team members or with your users to achieve consensus on an issue. The Matrix ranks issues by particular criteria determined by your organization. Based on the ranking of each issue, you then clearly determine priorities.
While this type of matrix is used effectively within many organizations, it is also a great tool for helping project teams with decision making, such as selecting projects, determining which measurement instrument to use, or how to manage new processes. A Prioritization Matrix can be used in making business decisions and to facilitate teams.
Members of your team, stakeholders, and project managers can utilize the benefits of a matrix when determining the most important issues within your business workflows. A Prioritization Matrix usually is a 4 column table. The first column contains a list of known issues. The 2nd-4th columns contain the criteria for ranking each issue.
Examples of typical criteria:
Each team member votes 3 times for each criterion, voting 9 times in total. The total number of votes clearly defines how to prioritize issues.
The Prioritization Matrix is a great tool, but can take a lot of time to do manually. ConceptDraw PRO makes creating a Prioritization Matrix easy.

While this type of matrix is used effectively within many organizations, it is also a great tool for helping project teams with decision making, such as selecting projects, determining which measurement instrument to use, or how to manage new processes. A Prioritization Matrix can be used in making business decisions and to facilitate teams.
Members of your team, stakeholders, and project managers can utilize the benefits of a matrix when determining the most important issues within your business workflows. A Prioritization Matrix usually is a 4 column table. The first column contains a list of known issues. The 2nd-4th columns contain the criteria for ranking each issue.
Examples of typical criteria:
- Frequency:
How frequent is the problem? Does it occur often or on rare occasions? - Importance:
From the user’s point of view, what are the most important problems? What are the problems that need to be resolved? - Feasibility:
How realistic is it that the problem can be resolved? Will it be easy or difficult?
Each team member votes 3 times for each criterion, voting 9 times in total. The total number of votes clearly defines how to prioritize issues.
The Prioritization Matrix is a great tool, but can take a lot of time to do manually. ConceptDraw PRO makes creating a Prioritization Matrix easy.

Monday, June 28, 2010
Managing a Sales Dream Team

Sales people are usually the face of the company. To do their job
properly a salesperson must be expert on the products they sell, as well
as being a contributing member of the team. It is very important
to maintain a constant communication flow within a sales team.
Oleg Bocharnikov Director of CS Odessa Sales shares his experience
of efficient sales team management and discusses the key elements of increasing communication flow within your
sales team.
Meetings
Have regular meetings, without scheduling too many! Meetings are important, but not every issue demands a meeting.
Have periodic meetings to discuss new sales activities or product information.
Incorporating the Brainstorming technique can be very useful if the goal of the meeting is to develop new sale ideas.
We use ConceptDraw MINDMAP at all stages of a meeting, from the brainstorm session — to carrying out decisions.
This is the value of brainstorming in a team — separating creation from evaluation, producing many ideas at once, and building on one another’s creative ideas and solutions.
Scheduling
Create a list of sales activities that your sales team should be doing each week. This list should include emails, phone calls, networking strategies, retrieving referrals from existing clients, and any other activity that is relative to your business.
Review Process
Use data such as weekly sales-activity reports to keep track of how well your sales staff is performing. Combine these reports with review meetings to discuss and celebrate results face-to-face. This willgive you the chance to address any problems or issues. Through a weekly review process you will be able to monitor your sales team and improve results.
Learning Process
Sales people need to fully understand the key benefits and features of products. The process of ConceptDraw products development is in constant progress. We have specialists who deal particularly with ConceptDraw PRO, ConceptDraw PROJECT and ConceptDraw MINDMAP. These specialists provide learning materials for our sales team, so that everyone within the company is a product expert!
Live Experience
The CS Odessa Sales team utilizing ConceptDraw products in their every day workflow. The entire sales process and workflow is documented and carried out using ConceptDraw Office.
We use ConceptDraw PRO to support the learning process, and ConceptDraw MINDMAP to conduct our meetings and brainstorm sessions. After meetings such mind maps are transformed into personal To Do lists
and task schedules in ConceptDraw PROJECT.

Wednesday, June 23, 2010
Google Wave Open to Public
Google Wave is out of it's invitation-only phase. Now anyone can sign up for the service. But it's fair to say that Wave hasn't found a big audience yet. This reminds me of when tablet pcs appeared on the market. Microsoft immediately released and touted its tablet pc app that supported gestures. But then it did just about nothing to build a market for the devices.
Apple is so good at creating developer communities around its products. I mean, how many iPhone apps are out there now? Granted, Google Wave just isn't as sexy as a new phone. But why doesn't Google do more to help companies like CSO get more attention. It will only increase interest in Google's own products.
Read Nick Saint's article from Monday's Business Insider for his take on Google Wave's problems.
Monday, June 21, 2010
Communication in R&D Project Management
The more resources involved in attaining R&D project goals, the more complex communication tasks become.
ConceptDraw Office is able to clearly define and implement the communication processes for your researchers. It is the tool to build long-lasting relationships between team members, expedite project activities, and keep control over projects by delivering necessary information in appropriate formats to all team members.
ConceptDraw Office addresses communication as a critical component in setting the stage throughout the research project phases.
The initial Idea stage is where project ideas are generated, selected, discussed and finalized. The main issue facing project managers at this stage is the need to understand the main goal and its requirements. Whether you are working on an internal or external project, there is always a need to discuss ideas and potential strategies, as project resource requirements must be calculated and understood amongst all project participants.
The suggested forms of communication at the Idea stage are brainstorm sessions, mind maps, business process models and presentations.
At the Planning and Executing stages, a project timeline is mapped out for task and resource (people, equipment, and materials) allocation. ConceptDraw Office contains the tools necessary to handle these two important stages.
ConceptDraw PROJECT is tightly integrated with ConceptDraw PRO, requiring just one click to automatically build a Work Breakdown Structure (WBS) chart for your project. Now it is easy to keep your WBS up to date. If more changes are needed, modifications to the project can be directly made in ConceptDraw PROJECT with the automatic rebuild of associated WBS.
ConceptDraw PROJECT also makes it easy to send detailed ToDo lists to all project participants. The typical amount of time it takes to communicate these tasks is significantly reduced to a minimum. Suggested forms of communication for the Planning and Executing stages are Gantt charts, WBS charts, flowcharts and ToDo lists.
Two other major components necessary for the success of a R&D project are Daily and Management Communication. Having a communication management strategy that is supported by ConceptDraw Office helps detail the needs and expectations of the team, how project data will be exchanged, and the responsibilities of each team member.
The communication process continues as long as a project is in action, to keep information flowing between all members of a project.
ConceptDraw Office minimizes the amount of project rework necessary and improves the everyday workflow of research project by utilizing visual methods to represent pertinent information. With visual methods it is easy to:
Suggested communication formats for the Communicate and Manage stages are Report Maps, Visual Reports, Project Dashboards, knowledge maps, mind maps and PowerPoint presentations.
Clear communication within a research team helps build a collaborative work environment, with an emphasis on a shared vision of goals. ConceptDraw Office offers an effective and innovative approach to building communication flow at all stages of a R&D project.
ConceptDraw Office is able to clearly define and implement the communication processes for your researchers. It is the tool to build long-lasting relationships between team members, expedite project activities, and keep control over projects by delivering necessary information in appropriate formats to all team members.
ConceptDraw Office addresses communication as a critical component in setting the stage throughout the research project phases.
The initial Idea stage is where project ideas are generated, selected, discussed and finalized. The main issue facing project managers at this stage is the need to understand the main goal and its requirements. Whether you are working on an internal or external project, there is always a need to discuss ideas and potential strategies, as project resource requirements must be calculated and understood amongst all project participants.
The suggested forms of communication at the Idea stage are brainstorm sessions, mind maps, business process models and presentations.
At the Planning and Executing stages, a project timeline is mapped out for task and resource (people, equipment, and materials) allocation. ConceptDraw Office contains the tools necessary to handle these two important stages.
ConceptDraw PROJECT is tightly integrated with ConceptDraw PRO, requiring just one click to automatically build a Work Breakdown Structure (WBS) chart for your project. Now it is easy to keep your WBS up to date. If more changes are needed, modifications to the project can be directly made in ConceptDraw PROJECT with the automatic rebuild of associated WBS.
ConceptDraw PROJECT also makes it easy to send detailed ToDo lists to all project participants. The typical amount of time it takes to communicate these tasks is significantly reduced to a minimum. Suggested forms of communication for the Planning and Executing stages are Gantt charts, WBS charts, flowcharts and ToDo lists.
Two other major components necessary for the success of a R&D project are Daily and Management Communication. Having a communication management strategy that is supported by ConceptDraw Office helps detail the needs and expectations of the team, how project data will be exchanged, and the responsibilities of each team member.
The communication process continues as long as a project is in action, to keep information flowing between all members of a project.
ConceptDraw Office minimizes the amount of project rework necessary and improves the everyday workflow of research project by utilizing visual methods to represent pertinent information. With visual methods it is easy to:
- open project files in ConceptDraw MINDMAP to modify schedules and project details
- effectively determine workload-to-work capacity and resource allocation in ConceptDraw PROJECT
- build charts and diagrams in ConceptDraw PRO that document processes and reports on project status
Suggested communication formats for the Communicate and Manage stages are Report Maps, Visual Reports, Project Dashboards, knowledge maps, mind maps and PowerPoint presentations.
Clear communication within a research team helps build a collaborative work environment, with an emphasis on a shared vision of goals. ConceptDraw Office offers an effective and innovative approach to building communication flow at all stages of a R&D project.
Friday, June 18, 2010
Create a Project WBS
Step 1. From ConceptDraw PROJECT open the “Aerospace Research” sample project.

Tip: Use Ctrl+Shift+B (Windows) or Cmd+Shift+B (Mac OS) to generate WBS.
Step 2. From the toolbar, click the Generate WBS button.

Step 3. ConceptDraw PRO will open automatically with the generated WBS displayed.

Result. Work Breakdown Structure diagram for an Aerospace research project.


Tip: Use Ctrl+Shift+B (Windows) or Cmd+Shift+B (Mac OS) to generate WBS.
Step 2. From the toolbar, click the Generate WBS button.

Step 3. ConceptDraw PRO will open automatically with the generated WBS displayed.

Result. Work Breakdown Structure diagram for an Aerospace research project.

Wednesday, June 16, 2010
Effectively Use a Mind Map to Take Notes During Meetings and Presentations
Step 1. From ConceptDraw MINDMAP, open the presentation map “History Of Psychology”.

Step 2. Turn on the Full Screen mode from the View menu or press F5.
Step 3. During a meeting or presentation, as participant states something of importance that relates to a particular topic, insert a callout attached to this topic. Select a topic, and right-click. Select Callout Topic.

Step 4. Enter notes or comments in the new callout.

Step 5. If you would like to create a callout that pertains to the entire mind map, instead of a specific topic, in a blank space of the mind map, left-click the mouse button while holding down the Ctrl key. Add a floating topic.

Step 6. Throughout the meeting or presentation, continue to add Callouts and Floating Topics.
Step 7. Add details as subtopics. Use Ctrl+Enter (Windows) or Cmd+Enter (Mac OS X).
Step 8. Use Symbols to make small notes and save words. In our example, we use the heart to visually depict the “Sensations/Feelings” topic. Press F9 to view the Symbols panel.
 Step 9. Repeat the above steps to modify and add to the mind map.

Result. At the end of a meeting or presentation, your mind map should be complete with important ideas, notes, comments, symbols, and callouts.

Step 2. Turn on the Full Screen mode from the View menu or press F5.
Step 3. During a meeting or presentation, as participant states something of importance that relates to a particular topic, insert a callout attached to this topic. Select a topic, and right-click. Select Callout Topic.

Step 4. Enter notes or comments in the new callout.

Step 5. If you would like to create a callout that pertains to the entire mind map, instead of a specific topic, in a blank space of the mind map, left-click the mouse button while holding down the Ctrl key. Add a floating topic.

Step 6. Throughout the meeting or presentation, continue to add Callouts and Floating Topics.
Step 7. Add details as subtopics. Use Ctrl+Enter (Windows) or Cmd+Enter (Mac OS X).
Step 8. Use Symbols to make small notes and save words. In our example, we use the heart to visually depict the “Sensations/Feelings” topic. Press F9 to view the Symbols panel.


Result. At the end of a meeting or presentation, your mind map should be complete with important ideas, notes, comments, symbols, and callouts.
Tuesday, June 15, 2010
Using ConceptDraw MINDMAP to Gather Requirements
After writing an article about using ConceptDraw MINDMAP to gather requirements, I got in contact with the Requirements Networking Group: Where Requirements Gatherers Meet. "RQNG" has lots of whitepapers, articles, and podcasts about everything from Agile to data warehousing to requirements security. Feel free to download a PDF of the article: Visually Mapping Requirements: An uncommon approach that just might make your job easier.
Tuesday, June 8, 2010
Create a Project Dashboard
Step 1. Open your ConceptDraw PROJECT file.

Step 2. From the Reports menu, select Generate Reports.

Step 3. From the Generate Reports window, select Project Dashboard, and click Generate.

Step 4: Your project dashboard is generated and opened in ConceptDraw PRO.

Result: ConceptDraw Project Dashboard.

Step 2. From the Reports menu, select Generate Reports.

Step 3. From the Generate Reports window, select Project Dashboard, and click Generate.

Step 4: Your project dashboard is generated and opened in ConceptDraw PRO.

Result: ConceptDraw Project Dashboard.
Sunday, June 6, 2010
Ye Olde Fashioned Questionnaire
A post on the Sielevel Software blog talks about using questionnaires to make sure project assumptions are correct. As I'm sure you've discovered, using mind maps is really an excellent way to ensure that everyone is on the same page when it comes to project planning. Maps are especially useful in early-stage planning for this very reason. By projecting a map on the wall, participants can make sure that there are no misunderstandings or misconceptions about the project.
But I liked this blog's idea of using questionnaires as the last step in the project planning process. Here's the example they give:
Please validate each of the statements below by answering “Yes” or “No”.
1. Customers with a classification of “REV” are NOT charged any Federal Taxes.
2. Customers with a classification of “REV” are ALWAYS required to pay Local Municipality Service Taxes.
3. The tax rate charged for Local Municipality Service Taxes for Customers with a classification of “REV” is ALWAYS the same as the rate charged for ALL other Customers.
4. Etc., etc.
If you're building maps together with a client to plan a new project or product, this step may not be necessary. But it might be useful if there is any question about the work at hand.
Friday, June 4, 2010
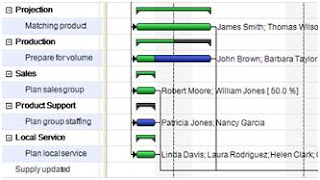
Use Project Dashboard Indicators
Step 1. From ConceptDraw PROJECT open a project file, such as the sample "New Product Launch".
Step 2. From the Reports menu, select Generate Reports.
Tip: Click the Generate Reports icon on the toolbar to run reports at any time.
Step 3. From the Generate Reports window, select Project Dashboard and click Generate.
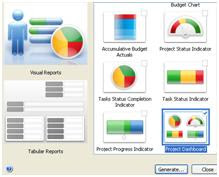
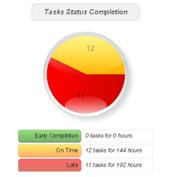
Step 4. The Project Dashboard appears. Look through the dashboard to review reports and indicators that require attention.
For example, perhaps the Task Status Completion indicator shows that 11 tasks are behind schedule.
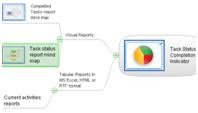
Step 5. From ConceptDraw MINDMAP, open the "Reports Guide" sample mind map. Find a report that is associated with the indicator that requires attention. From the Reports Guide, the select the Task Status Report mind map.
Step 6. From ConceptDraw PROJECT, go to the Reports menu, and select Generate Reports.
Step 7. From the Generate Reports window, select Tasks Status, then click Generate.
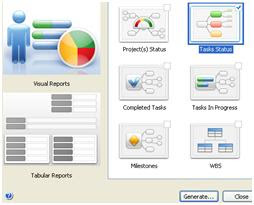
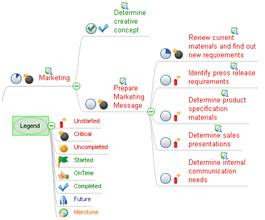
Result. An interactive mind map that assists in determining task status.

Step 2. From the Reports menu, select Generate Reports.
Tip: Click the Generate Reports icon on the toolbar to run reports at any time.
Step 3. From the Generate Reports window, select Project Dashboard and click Generate.

Step 4. The Project Dashboard appears. Look through the dashboard to review reports and indicators that require attention.
For example, perhaps the Task Status Completion indicator shows that 11 tasks are behind schedule.

Step 5. From ConceptDraw MINDMAP, open the "Reports Guide" sample mind map. Find a report that is associated with the indicator that requires attention. From the Reports Guide, the select the Task Status Report mind map.

Step 6. From ConceptDraw PROJECT, go to the Reports menu, and select Generate Reports.
Step 7. From the Generate Reports window, select Tasks Status, then click Generate.

Result. An interactive mind map that assists in determining task status.

Wednesday, June 2, 2010
Present Project Status
 Comprehensive project status reporting means staying ahead of the game when it comes to identifying and communicating necessary changes and updates. All project participants are able to work towards common goals as they work towards project progress.
There are two critical area of communication during a project life cycle. The first is the communication of task assignments and the status of the tasks assigned. The second is the accurate and timely communication of project status.
The ability to communicate project status in real-time is not a common functionality that Project Managers expect out of the software tools they use. The irony is that all too often the information that is necessary to communicate is hard to retrieve, because the data is locked in their application’s project file. Day-in and day-out, during the life of a project, it is a critical for success that Project Managers exchange timely project information and report on a project’s status to all active participants and stakeholders.
There are many tools on the market that enable users to report and communicate task assignments. While some of these tools are rich with reporting features, they also tend to be very complex and not intuitive for users who need to create vital reports on current task situations and the impact of the current status on projects. More times than not it is complicated to determine and communicate accurate project status, and understand inter-project impact of resource allocation.
Project Managers need to be able to understand and explain project details at any level of granularity via telephone, email, project meetings, flow charts and diagrams, project presentations, and sometimes even white board presentations. The most critical skill set a Project Manager can have, without question, is the creativity to communicate and manage people.
There are some simple and basic guidelines that are important to follow when reporting project status to project and non-project managers:
- Be Intuitive.
The report must be a straightforward and concise presentation of critical project information that represents project status and details. - Keep it Brief.
Report presentations should have a simple yet informative layout. One page is optimum to make project information easy to review. - Be Compelling.
The audience must be able to quickly locate what requires attention and/or immediate action. - Keep it Easy to Learn. No special instruction should be needed to read the project status.
ConceptDraw Office, developed by CS Odessa, has taken all these important elements into consideration, by building powerful real-time report functionality into ConceptDraw Office that accurately conveys status to all individuals.
The visual Project Dashboard within ConceptDraw Office, is the best way to deliver a clear view of project performance to all project participants. The multiple types of reports help present project status in a simple and visually appealing format. With the Project Dashboard, you can easily concentrate hours of work into a visual representation that takes just 30 seconds to interpret.
This dashboard ensures that project teams are up to date and all on the same page as they can review milestones and action items while addressing any outstanding tasks.
Wednesday, May 26, 2010
Google I/O Developer’s Conference 2010

CS Odessa was in the Sandbox at Google I/O to show our mind mapping solution for Google Wave, ConceptDraw MindWave. There was a huge level of interest shown in our collaborative mind mapping tool.
With ConceptDraw MindWave, it doesn’t matter if you want to collaborate with 2, 20, 200 or 2,000 other participants. The same time editing is available, all additions and changes are labeled to identify each participants contribution.
Sub components of the MindWave mind map may be dragged and dropped to change structure. There is a search function to look for specific map content, and the branches can be folded and unfolded with a click of the mouse. Content from your desktop can be pasted into map structure, and map content can be copied and pasted to your desktop.
Another feature of the Google MindWave is the [lay back of the construction of the map. The finished ConceptDraw MindWave map located within Google Wave can then be downloaded to your desktop. You can continue working on it using ConceptDraw MINDMAP.
All of this mind mapping power and amazingly well thought out functionality of ConceptDraw MindWave is absolutely free. It does not cost one dime!
All that is required is a Google Wave account. Simply set up or log in to your Google Wave account.
Click here to install the ConceptDraw MindWave gadget.
Tuesday, May 25, 2010
Create Your Own Multi-Page ConceptDraw MINDMAP Template
Step 1. Open a new mind map document with ConceptDraw MINDMAP.
Step 2. Open the Page Navigator.
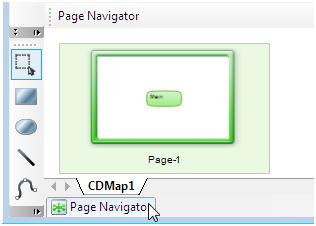
Step 3. To add a new page, double-click anywhere in the empty workspace in the Page Navigator. Add the required amount of pages.

Step 4. From the File menu, select Save as Template… or Ctrl+Alt+S to save the document as a template.
Step 5. From the Edit menu, select Preferences.
Step 6. The Preferences window appears. From the General tab, in the New document section, select From template:.
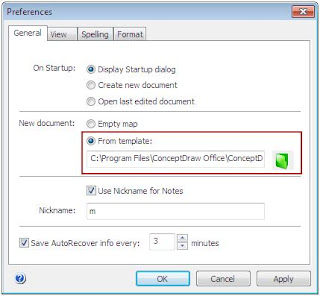
Step 7. Select the saved template file, and click Ok.
Tuesday, May 18, 2010
Design Web Page Mock Ups with ConceptDraw PRO
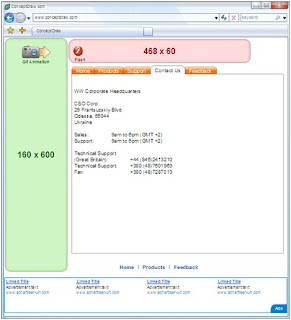
Step 1. From the ConceptDraw PRO File menu, select WebWave Panel. In the Design Wireframes section, click Design page mock-up .
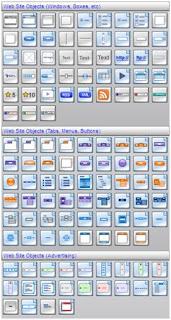
Step 2. Add page elements by dragging and dropping them from the object library to the document workspace.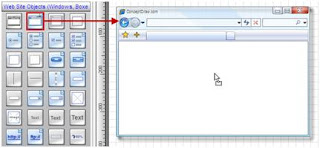
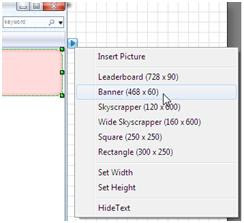
Step 3. Modify objects using their Action buttons.
Step 4. Add text to objects, such as tab buttons by selecting it and entering text. Make the selected object active by using the Action button.
Result. An interactive web mock-up page, that may also be used to preview web pages within a web site map.

Step 2. Add page elements by dragging and dropping them from the object library to the document workspace.


Step 3. Modify objects using their Action buttons.

Step 4. Add text to objects, such as tab buttons by selecting it and entering text. Make the selected object active by using the Action button.

Result. An interactive web mock-up page, that may also be used to preview web pages within a web site map.

Subscribe to:
Posts (Atom)


