
Well, if you think it's time your organization did the same, you might be interested in a new CD PRO solution: Cross Functional Flowcharts.
Here are a couple examples of the kinds of charts you can create:
Process Improvement
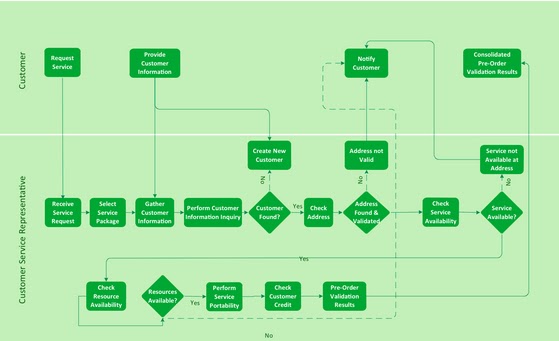
This example shows a business process diagram that can be then analyzed for ways to improve the process effectiveness and diagnose quality issues that require resolution:
ESL Communications
The next example shows a workflow for replacing engine oil. It explains all the steps clearly and visually:

Diagrams like this can be used for training. And with our increasingly multicultural work force, visual images like this can help communicate processes to people for whom English is a second language (ESL).
Vector Graphics
The Cross Functional Flowchart solution extends ConceptDraw PRO v.9 software with templates, samples, and a library of vector shapes for drawing the flowcharts. The charts can help you visualize and communicate the operations of a business process flow step-by-step, with the responsible people or departments for each operation clearly indicated.
All source documents are vector graphic documents. They're available for reviewing, modifying, or converting to a variety of formats (PDF file, MS PowerPoint, MS Visio XML, and many other graphic formats) from the Template Gallery of ConceptDraw PRO. You must have the Cross-Functional Flowcharts solution installed to access these documents.


 Posts
Posts


