News and thoughts from CS Odessa, maker of the ConceptDraw product line: ConceptDraw PRO, ConceptDraw PROJECT and ConceptDraw MINDMAP.

Saturday, February 28, 2009

3P: Pre Pitch Planning


Figure 1: A ConceptDraw MINDMAP used in a presentation

Baseball pitchers know all about “Pre Pitch Planning”. They use this technique to carefully plan out each time they are going to throw a baseball. They need to think about how they will hold the ball, the release point, the motion placed on the ball, the velocity at the time of release, the intended destination point, and of course-- the batter.

The same 3P technique can be use when presenting mind maps created from ConceptDraw MINDMAP. ConceptDraw MINDMAP is a great tool for creating informal presentations or when you what to interact with the group you are presenting to.

I have built a small map that is located at MindMapPedia.com: http://www.mindmappedia.com/?id=214646313. You can easily download this mind map to see how you can configure some of the items discussed in this posting. Keep in mind, this post is focused on how to present using ConceptDraw MINDMAP.


Here is a list of some of the things you want to take into consideration when you present your mind map.


  • Not everyone is familiar with how to read a mind map. Knowing this, I like to have my main idea left aligned and all the topics aligned to the right.

  • Ensure the default font is big enough at each level being presented, so it is legible to your audience.

  • Adjust your background color and topic colors to match your team or company style.

  • Ensure “Auto Arrangement” is on, and if you want to eliminate the distraction of the menu, press F5 (this toggles full screen mode on and off)


Auto Arrange toggled on

  • To present press the plus symbol to fold out a branch for display. When you are ready to move to the next branch, you collapse the branch you are viewing, using the minus symbol

  • If you fold all of the subtopics out, when you open the branch they are attached and will be revealed at the same time.

  • If the subtopics are folded in, when you open the branch, they will be revealed one at a time.

  • For easy and rapid zooming on any topic or group of topics in your map, just rubber band the topics you want to view by holding briefly, and the objects will automatically zoom. http://www.blogger.com/video-play.mp4?contentId=53a4f85011dd66bf&type=video%2Fmp4


ConceptDraw zoom demonstration

  • When you want to return to normal size, release the mouse and the map is restored to the previous view.

It is easy to present your map, but like baseball, you should always practice before you go in front of a live audience.

There are two other features contained in ConceptDraw MINDMAP that can come into play here and that is templates and themes. In the next few future postings I will delve into templates, because they are great tools with the potential to save you time. Templates can contain both a theme and information. A template has many uses.

Thursday, February 26, 2009

Mind Map Topic Relationships Inside of ConceptDraw PROJECT

In the January 29, 2009 post on this blog which can be viewed at http://mapthink.blogspot.com/2009/01/building-relationships-between-mind-map.html, I described how one could build different types of project management relationships between two different topics in a mind map. In today’s post I am going to show you how those relations that are visually represented in a map, are depicted in a Gantt chart.

Start to Start
The first of these is a start to start relationship in a Gantt chart. Both tasks need to start on the same day, but their ending dates depend on the size of the task and the level of resources assigned. Here both tasks start on March 27th with one of the tasks scheduled to take one day for completion and the other taking three days for completion. You will notice that Task Two occupies 5 days because the 28th and 29th are weekend days and with the current project settings there is no work scheduled for the weekend.

Notice the relationship arrow between the two tasks signifies that they both start at the same time. The task relationship can be unlinked or changed by highlighting the two tasks in ConceptDraw PROJECT and doing a right click to view the “Tasks Link” option.

Finish to Finish
The second of these topic relationships are the finish to finish relationship in a Gantt chart. Both tasks need to finish on the same day, but their start dates depend on the size of the task and the level of resources assigned. Here both tasks end on March 27th with one of the tasks scheduled to take one day for completion and the other taking three days for completion. You will notice that Task Two occupies 3 days in this example, because Task Two does not cross a weekend. Notice the relationship arrow between the two tasks signifies that both tasks end on the same day.

Finish to Start
The third example is a finish to start relationship in a Gantt chart. One task starts, when it is completed the next task starts. Task One occurs on a Friday and is only one day long, Task Two starts on the next Monday (no work is scheduled in this view for weekends). Notice the relationship arrow between the two tasks signifies that when the first task is completed the second task starts.

Start to Finish
The forth and last example is a start to finish relationship in a Gantt chart. One task finishes, when it is completed the next task starts. Notice the relationship arrow between the two tasks signifies start to finish relationship.

Now if only it was that easy for people to establish a great relationship! Next post will be on using ConceptDraw MINDMAP for presentations.

Thursday, February 12, 2009

Gaining Group Consesus

Map showing importance of fire safety to management team looking for new office location

Making a decision can be a hard task to accomplish, add more people and it becomes MUCH harder. As you add people the task becomes exponentially harder. Using a mind map is a great way to work with a group of people and to identify what is really important. We recently had this map shared with us on an exercise that a local company’s management team went through to determine where would be a suitable place for them to locate. Each member of the management team was given points that they could allocate to a set of criteria that was determined by a brainstorming session. Nineteen criteria were identified and then randomly placed on the map. No topic could receive more than 100 points. They then had each of their managers determine how many points they wanted to spend in each category. This company broke the decision into two small meetings a day apart, but the decision could have been made in one meeting. The marketing person who built the map added clip art to each item, which helped them visualize what the criteria was and kept everyone on track.

The brainstorming session was finished in 10 minutes. The allocation of points among the managers was 15 minutes, with the CFO putting most of her points on the cost factor. The points were added up and placed in the task portion of the topic as a percentage complete of that topic, then ConceptDraw MINDMAP’s auto numeration was turned on and the topics were sorted by percentage complete. Starting with the largest percentage of completion at the 1 o’clock position and moving clockwise to the smallest percentage of completion.

Next the managers had a discussion among the team. Was a variety of places to eat lunch really number two in their selection criteria? Is not the type of landlord more important than a last place ranking? By looking at each of the criteria and seeing where it fell in relation to the other criteria they were able to make better assessments. Once the criterion was ranked in an appropriate manner it became easier for the company to conduct their site search, and make a decision based on the reasons they identified. They were happy with their final results.

The decision map that was built can be downloaded from here http://www.mindmappedia.com/?id=100268315

Monday, February 9, 2009

Work Break Down Structure Generation is a Snap With ConceptDraw Office

An important tool in project management and systems engineering is the Work Breakdown Structure (WBS). The WBS defines a project and a group’s distinct work elements that helps to organize and define the work scope of a project.

WBS also provides the necessary framework for estimating cost along with a high level view that can be used for schedule development and control. ConceptDraw Office is a dynamic tool that builds a WBS by copying the tasks you wish to diagram from the Gantt view in ConceptDraw PROJECT and then pasting them ConceptDraw PRO. ConceptDraw Office makes it so easy to revise and update your WBS as needed.

In ConceptDraw PRO the WBS is editable, for changes and/or presentation. ConceptDraw Office has many features that help eliminate wasted time in report generation and permit team members to focus on the project at hand rather than building diagrams.

Sunday, February 8, 2009

ConceptDraw MINDMAP Top Selection in March MacWorld

ConceptDraw MINDMAP was selected as “Our Pick” by MacWorld. MacWorld tested and compared nine mind map candidates in the March edition. We are very proud of being selected.

Thursday, February 5, 2009

Porter's Five Forces in a ConceptDraw Mind Map

Porter's Five Forces in a Mind Map

Like analysis tools? How about a mind map template for Porter’s Five Forces which is often used for industry analysis?

I have placed a ConceptDraw MINDMAP template here http://www.mindmappedia.com/?id=113810816 for anyone to download that is setup to help you capture and display your data using Porter’s Five Forces. I placed a small example in the same map on page two so you are able to see how to build the map. I used Ford Motor Company as my example and I would like to place a disclaimer here that I am not an automotive industry expert, but built it to show how the data could be structured and displayed.

One other benefit from this map is that when you use this template and get it setup for your industry it exports really well into a PowerPoint slide presentation using the ppt outline mode export. I find this very handy for presenting observed results.

Wednesday, February 4, 2009

Using Maps Not Built With ConceptDraw MINDMAP

Importing into ConceptDraw MINDMAP

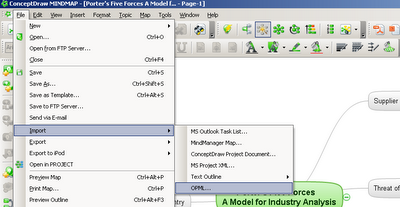
Occasionally you might have the need to open a mind map that was built in a software product other then ConceptDraw MINDMAP. With ConceptDraw MINDMAP you have the capability to import mind maps with different file formats. Many products have the ability to output to either text outline format or Outline Processor Markup Language (OPML). Both of these formats can be easily imported in to ConceptDraw MINDMAP for review and editing purposes:

If you use FreeMind, there is an easy export function that that can provide an OPML structured file which can then be imported into ConceptDraw MINDMAP.


  • File -> Export -> Using XSLT...

  • Choose XSL File -> browse to the directory where you installed FreeMind -> then to 'accessories' -> select 'mm2opml.xsl'

  • Choose ExportFile -> browse to wherever you want and give a file name ending in .opml

If you use Mindjet MindManager, you can utilize the direct import function within ConceptDraw MINDMAP to import and edit mind maps from MindManager in ConceptDraw MINDMAP.