News and thoughts from CS Odessa, maker of the ConceptDraw product line: ConceptDraw PRO, ConceptDraw PROJECT and ConceptDraw MINDMAP.

Wednesday, July 17, 2013

Popularize Mind Mapping One Student or Classroom at a Time

I talked with one of the academic/career advisors at Boise State University today. It turns out that they have someone on staff who's in charge of putting together academic skills training programs for students. These programs help improve study habits, note taking, research organization, and writing.

I haven't been able to talk to this other staff person, but I know two things that I want to talk to them about:

  1. Do you teach mind mapping to students? If so, what do you teach them to do?
  2. If you don't, can I come in and teach a class or two?

How About You?
I'm sure BSU isn't unique in offering these classes to student. What would it take for you to contact the nearest community college, vocational/technical college, or university and ask them if you could teach a class?

I run into some many parents whose children have learning problems. Few of these parents have heard of mind mapping or how it can help kids with dyslexia, who struggle with reading comprehension, or who have a hard time organizing writing assignments. I've gone into local schools and taught classes to 5th graders, and have gotten a good reception from students and teachers alike.

You may not think you're a mind mapping expert. But I bet you have all the skills you need to show students of all ages how to become more productive and less frustrated.

Monday, July 15, 2013

New Process Modeling Tools Now Available at ConceptDraw

I blogged a while ago about how a marketing company owner I know realized, after a discussion with a client, that she needed to do a better job communicating to clients all that's involved in executing a marketing campaign. Her solution was to use ConceptDraw PRO.

Well, if you think it's time your organization did the same, you might be interested in a new CD PRO solution: Cross Functional Flowcharts.

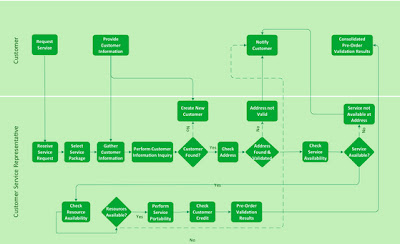
Here are a couple examples of the kinds of charts you can create:

Process Improvement
This example shows a business process diagram that can be then analyzed for ways to improve the process effectiveness and diagnose quality issues that require resolution:

ESL Communications
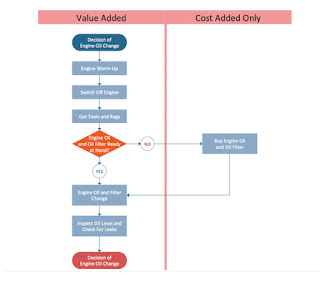
The next example shows a workflow for replacing engine oil. It explains all the steps clearly and visually:

Diagrams like this can be used for training. And with our increasingly multicultural work force, visual images like this can help communicate processes to people for whom English is a second language (ESL).

Vector Graphics
The Cross Functional Flowchart solution extends ConceptDraw PRO v.9 software with templates, samples, and a library of vector shapes for drawing the flowcharts. The charts can help you visualize and communicate the operations of a business process flow step-by-step, with the responsible people or departments for each operation clearly indicated.

All source documents are vector graphic documents. They're available for reviewing, modifying, or converting to a variety of formats (PDF file, MS PowerPoint, MS Visio XML, and many other graphic formats) from the Template Gallery of ConceptDraw PRO. You must have the Cross-Functional Flowcharts solution installed to access these documents.

Wednesday, June 12, 2013

Does the NSA Use Mind Mapping?

The scenario I mentioned in yesterday's post about data and the meaning of data relates to recent news surrounding the NSA. This secretive federal agency has been embroiled lately in news about its collection of massive amounts of data American citizens generate through the use of the Internet.

A Double-Edged Sword
The person who leaked news of this collection, a private contractor named Edward Snowden, is being proclaimed a hero and a villain. Clearly, there were other avenues open to him if he wanted this information to become public.

But the idea of the government collecting unimaginable amounts of data on what are considered the private activities of millions of people, without them/us knowing about it... that's plenty troubling too.

How Do You Personally Define Freedom? Freedom from what?
From what I understand, the government's plan is to continually amass data, and then to comb it with ever-more-powerful, intelligent tools. The goal: Discover as soon as possible those sharp needles in the haystack: (Read the new WIRED story about this.)

I get the part about data visualization. We need tools to compress this information into forms we can understand. But then there is the next step: Drawing conclusions and taking actions based on that data.

I personally wonder what tools the NSA uses to take this second step. We know that mind mapping is used for some very key projects at some very large organizations, both public and private.

And I remember those strong rumors that a federal intelligence agency bought a number of mind mapping software licenses the day after 9/11. We will never know the tools being used in the most secretive of secret places.

Is Data Synonymous with Truth?
So many resources are dedicated these days to developing the technology that supports the first part (data viz). But how far have we come to help people draw the right conclusions from the data?

Our belief in -- or at least our reliance on -- Big Data will only grow as we use it to make more and more decisions. Will we get better at developing tools to help us make sense of it all?

Tuesday, June 11, 2013

Thanks, Marissa Mayer

Long time since last post... oh well. Blogging should be about posting when you have something to say, not because you need to put something up X times per X.

This reminds me of a time when I was hiking in the Enchanted Valley in the Olympics (WA state). We ran into a guy who was sitting in the middle of a soggy depression, staring at a thicket of devil's clubs (nasty plant!!). When we suggested to him that there was a great view just around the bend, he said, "No, I stop to rest every half hour. It doesn't matter where I am." But I digress... Back to Marissa.

It suddenly dawned on me today that mind mapping adherents owe her one for her whole no-more-telecommuting thing. I say that after a couple of hours spent searching with terms like "information visualization," "Idea visualization" and so on. The two results come together in a sentence like:

Use data viz to make sense of the data, and then come together with others and use your new-found insight to make a decision or reach a conclusion.

The thrust of her argument I think is that it is in those serendipitous meetings in the hallways that new ideas are born. I can agree with that--as long as people feel like they have the time and chat for a minute, and as long as they aren't worried about "owning" any idea that might spring forth.

I work from home now and sometimes miss that serendipity. I get it now when I visit my clients and at the organizations I volunteer for. It's one of the most entertaining and affirming parts of the work day.

Thursday, May 9, 2013

Lawyers: Help Startups Make Good Decisions

Last week I spoke with Russell Case, an attorney here in Boise. He just started using ConceptDraw MINDMAP in his legal practice and is pretty thrilled with the results.

Case's work falls into three main categories: corporate expansion, international law, and business startups. While each category is unique, they all have one thing in common: Success depends on his clients fully understanding the choices before them and the implications of the choices they make.

“By using MINDMAP or PRO," Case says, "I can create a visual document that shows them where they are now, where they’re trying to get to, and the decisions they’ll most likely have to make on the way. What’s so great about these programs is that they make it easy for me to show them the most likely implications of each decision. That makes for a much more informed client—one who is able to make better decisions.”

Case says he works with startup clients to, for example, brainstorm around the things they’ve looked at to confirm their market analysis—the size of the market, their opportunity, who their ideal customer is, how their product of service is different from competitors. He talks to them about their intellectual property, what they’re trying to create, when they will need money, and how much they’ll need.

“I can capture all this information from them in real time, drill down into each one as much as we need to, organize it all into a logical structure, and then use it to build the story they’ll present to investors. It’s an incredibly efficient, thorough process.”

Monday, April 29, 2013

Free Upgrades to ConceptDraw PRO

CS Odessa has just announced important free upgrades to the company’s ConceptDraw PRO business graphics and diagramming package.

ConceptDraw PRO 9.4 features an enhanced startup wizard, new connectors technology and ConceptDraw Solution Park additions to help users produce professional results more quickly, easily and cost effectively. The upgraded ConceptDraw PRO package demonstrates CS Odessa’s ongoing commitment to continuously improving its solutions suite.

Improvements include:

  1. A new Start Up Wizard that allows users to set basic formatting features.
  2. Arrows 10 technology to streamline object linking.
  3. New Solution Park enhancements, including new templates and libraries to help users quickly and efficiently produce professional results.

"The new startup wizard can help users begin each new project more efficiently and effectively," says Olin Reams, General Manager, VP of Sales & Marketing Americas at CS Odessa. "Smart Connectors technology enhances the intelligent design of the product since it fits the way people think instead of program operations."

Monday, April 22, 2013

Why companies should care about sustainability.

Last week I blogged about why investors care about sustainability. The other side of the coin is to consider why companies should care about it.

The most obvious reason is that companies (public companies, anyway) should care for the very reason that investors care. And the corollary to that is that companies should care not only because investors do, but because investors care enough that this secondary market in sustainability info is springing up.

Firms that provide investors with financial information think they can make money by supplying investors with this information (and just so we're clear, these are large institutional investors, not mom and pops).

So companies also need to care because they need to have information on their sustainability program easily accessible to these information suppliers. If they don't, they will sooner or later stick out like a sore thumb among companies who do.

But there are other reasons, self-interested reasons, why companies should care:

So... what is your company doing about this latest litmus test for corporate health?

Thursday, April 18, 2013

Nodes are Still News: Robert Kosara in Harvard Business Review Blog

I mentioned eagereyes.com the other day. This is the braindhild of Robert Kosara who, it turns out, is a very prolific thinker on the subject of data visualization.

I ran across his work again today in a post on the Harvard Business Review Blog. Here's the map I made of his post (and I'll post it to Biggerplate):

What I thought was interesting about his post was that:

  1. He mentions node maps. (I say this as one of the brotherhood/sisterhood of people who don't get why mind mapping, such a powerful approach to information management, struggles so hard to find an audience. So it's always nice to see this approach mentioned, however tangential to the way mind mapping is normally used. And ever nicer to see it mentioned in the HBR by someone of Kosara's stature among data visualization professionals.)
  2. He brings up the issue of the "potential interaction" between visual and linguistic metaphors used in node-link diagrams and treemaps. It's exciting that people are looking at this interaction, something that I think people who mind map at least think they understand and try to leverage.

In another recent paper, Thinking Deeper About Visualization, Kosara wrote something that, I have to admit, made my heart skip a beat:

For example, two separate participants explained that they considered the donut chart less stable because it seemed like it might “roll away.” This kind of analysis also seemed to underly the evaluations of the bubble chart as unstable and uncontrolled, with participants describing this chart as “floating bubbles that were barely contained within the area” and “scattered.” Similarly, charts without joined pieces were often described as “flying apart” or “exploding.”

Is he referring to mind maps when he says bubble charts (I have heard people use these terms interchangeably)? Do people feel that way when they see a mind map? Is all hope lost?

But further communication with Kosara relieved me when he said he was referring to a scatterplot, like this one from Gapminder (gapminder.org):

I have asked Kosara whether he plans to pursue research into the potential interaction between visual and linguistic metaphors he mentioned in the HBR blog. I'll let you know if I hear anything from him...

Wednesday, April 17, 2013

Do Investors Care About Corporate Sustainability?

I ran across a PriceWaterhouseCoopers report on whether investors care about a company's efforts to be more sustainable--and not just in the environmental sense of the word. The conclusion: Boy do they.

The report, Do investors care about sustainability? Seven trends provide clues, provides evidence of an interesting loop: Investor interest in sustainable practices has become so popular that financial reporting companies are now starting to provide easy access to information on these practices. As companies realize how easy it is for investors (and potential investors) to get a hold of this information, they upgrade their own sustainability reporting practices.

Investors are becoming interested in sustainability because recent studies indicate a direct correlation between sustainable practices and profits.

Sustainable practices include such things as:

  1. Better management of natural resources that go into a companies products. (A beverage company must protect long-term sources of potable water.)
  2. More attention to waste products that flow out of factories.
  3. More concern for worker health and safety.
  4. More attention to how the company's operations affect the community in which it's located.
  5. More attention to making sure energy grids are maintained and that energy generation is sustainable.
  6. More attention to climate change and its implications on supply and risk.

Here's the map. I'll post it on Biggerplate too:

Friday, April 12, 2013

Have you laid eyes on eagereyes?

Making the seredipitous choices that constitute the average Internet experience, I found a site today called eagereyes.org. If you're interested in the visualization of information (and if you mind map, how could you not be?), then you might like this site.

The site is run by Robert Kosara, a Visual Analysis Researcher at Tableau Software, and formerly Associate Professor of Computer Science at UNC Charlotte. He says on the site that "He has created visualization techniques like Parallel Sets and performed research into the perceptual and cognitive basics of visualization."

A recent post is called The Revolution Will Be Visualized. Here's an example of one of the data visualizations, this one on the number of gun deaths in the U.S. in 2013:

Here's another way to look at the data:

Not the cheeriest subject matter, I admit. But it does give you a aense of the power of information graphics. Where is the cross-over between mind mapping and information visualization? What does that Venn diagram look like?

Tuesday, April 9, 2013

My Views on Biggerplate Event


Great image from Paula J. Becker Illustrations at http://paulabecker.com/blog/

Have we all been here before?
After going through every one of the Biggerplate presentations, I took some time to sit back and reflect on what I thought was the overall message of the event.

There was some good thinking done about what is keeping mind mapping from the mainstream, along with some possible ideas of how we might get there.

But I have to say that none of the ideas were particularly gripping. Having been active in the mind mapping community for more than a decade, I can say with all honesty and candor that it gave me a bit of a sense of deja view.


Image from Forbes.com

Time for an all-inclusive social media desktop?
I had a conversation the other day with another mind mapping gray beard. We agreed that one of the strengths of mind mapping software is its ability to bring together in one screen information from many sources.

But as the number of information sources has mushroomed, mind mapping seems to be getting left behind.

When is one of the market leaders going to create maps that aggregate in real time the information that's coming in from Twitter and Facebook, Pinterest and Tumblr? My friend wanted to know when he'd be able to drag someone's Linkedin profile into a map he's building to strategize on customer acquisition.

More mixing. More mingling.
It is great that Liam Holmes brought everyone together for this event. It's exactly what the mind mapping community needs to collaborate its way to the future.

It would be cool if, next time, there's a mix of mind mappers and people engaged in developing new social information sources. Let's see how we can all play nice together.

Monday, April 8, 2013

Final Biggerplate Speaker: Thomas Thornton of MindMeister

This is the ninth and final recap of the presentation at the January Biggerplate event in London. To see each presentatioin in its entirety, please refer to The Mindmap Blog's "Mindmapping Thought Leaders Share Best Practices in London" for each speaker's video.

Teach your children
The final speaker was Thomas Thornton of MindMeister. Given that the theme of the Biggerplate event was getting mind mapping into the mainstream, Thomas began by suggesting that one good way to get there was by focusing on encouraging the use on mind mapping within education. He said that students are a good target because they are open to new ideas and usually willing to embrace new technology.

(Other companies have taken this approach in the past, with greater or lesser success. Many companies also include education pricing in their sales structure. But I personally think it is fair to say that Inspiration is the only company that deals with mind mapping that has made bringing mapping to the young the key focus of its business model. It's actually kind of odd that Inspiration is never mentioned when mind mappers talk about mind mapping. Why is that?)

What's the problem?
Thomas noted that some of the main barriers to acceptance among educators are:

  1. Political forces inside a school system (small "p": the social forces inside a school)
  2. The fact that creating mind maps can be time consuming.
  3. The need to train teachers in how to mind map.
  4. The need to train students themselves in how to mind map.

But there is nothing unique about any of these barriers. They are the same ones mind mapping companies face in pushing their technology into businesses. The one difference may be what he mentions first--that younger people are just more open to trying new things. Another advantage may be that professional educators are always on the lookout for new ways to help kids learn.

Thomas described how he taught mind mapping at one elementary school, first having the kids create a mind map of themselves, then having them build one together. The principal was sufficiently impressed to ask him to come back and teach more classes.

Can Ubiquitous Connectivity Help the Spread of Mapping?
Thomas referred to Seth Godin's "pre-connected" and "connected" worlds. The first refers to the time when information was scarce and processed by people in isolation (think someone at a library digging through the stacks alone).

In the connected world, information is not just plentiful, but offered up in a world of tremendous, 24/7 connectivity and at least the opportunity for relatively accessible ways to collaborate. And that may give mind mapping companies new routes to the mainstream.

Provide the technology and the context

Thomas offered up as a case in point--a recent article in a German newspaper about organ donations. The newspaper wanted to create a lot of conversation around the topic. So in addition to listing comments in the standard text format, they also gave readers the ability to add comments to a mind map.

First the paper give readers instructions on how to read a mind map. Then the showed how to enter comments into the map. (There was a very simple color-coded format for comments.) So this experiment on the part of the newspaper.

It also get mapping in front of millions--and in a context that helps make it clear how mind mapping can help the process of knowledge sharing.

Wednesday, April 3, 2013

Biggerplate Continued: John Barber on Expanding the Mind Mapping User Base

(Please refer to The Mindmap Blog's "Mindmapping Thought Leaders Share Best Practices in London" for each speaker's video.)

John Barber brings to the table the freshness and enthusiasm of someone new to mind mapping--"new" being relative to the decades many in the audience have been mapping. He explained how he, like so many mind mapping practitioners, began using this approach when he saw one of his coworkers in a previous job using mapping to take notes.


Image from Betterment.

Gently passed from one individual to another
When John asked the guy why he'd never shared the methodology with others, the coworkers said that it was his own little way of doing things. Once John understood how his colleague was using mapping to organize work, John quickly saw how much mapping helped not only his coworker but the entire team--and began using it himself.


Image from The Telegraph.

A Compleate Historie of the Moderne Worlde
Just to put mapping technology into context, John then embarked on an annotated history of information technology, spanning the distances between ARPANET, Apple, email, instant messaging, and micro-blogging. He then made a very nice transition into how these tools supported or failed what then became the thrust of the rest of his presentaion: Collaboration.

Full of sound and fury, signifying nothing?
Has enterprise collaboration lived up to its hype, he asked. Then he offered two data points: People on average spend about 70% of the work week in some kind of collaboration, and only 3% of companies derive any benefit from social technology.

That leads to the obvious conclusion that there is something missing in how we are all collaborating. And that something, he posits, may well be the lack of visualization in how we collaborate.


Image from PPC for Hire.

The search for mind mapping's sweet spot
But what or where is the need, and how do we know it's there? John described how Mindjet has commissioned research to figure out what C-level business people are interested in these days. The hot trend is, according to Mindjet's experts, is "organizational efficiency."

Okay, that seems like something mapping could help with. But how. John notes that more research reveals that half of all employees "care passionately about their company's goal" but lack either the knowledge or the will to actually do things differently to help reach those goals.


Image from HubPages.

Tick Tock
Perhaps, John concludes, visualization is the "secret sauce" that, when added to collaboration and messaging/social technology, can turn the Stone Soup of good intentions into something savory. Is it just a matter of time, he asks, until this trend takes hold? He laments that mind mapping has been around for more than 40 years and we aren't there yet.

But with additional education and increased awareness (thanks to sites such as Biggerplate), John is confident that mind mapping may yet be swept into the mainstream.

Tuesday, April 2, 2013

Biggerplate Continued: Andrew Wilcox on Finding Maps Online

(And once again, please refer to The Mindmap Blog's "Mindmapping Thought Leaders Share Best Practices in London" for each speaker's video.)

Andrew Wilcox from Cabre had a short but interesting presentation. He was curious about how easy it was for people to find mind maps online. So he did a little test. The test was a good example of how one can occasionally step outside of one's own point of reference to see what the world looks like to others.


Image from Strangerush.com.

Why do bank robbers rob banks?
Andrew's unstated assumption was that it's pretty easy for people immersed in mind mapping to find all the maps they want by searching online. Like the bank robber, we know where to look (such as Biggerplate). We know common file extensions. We know specific terminology that might increase our chances of success. So it's not surprising that we may think that it's fairly easy for anyone to find maps online. Alas, not so. And therein lays the rub.

Andrew's Empirical Examination
Andrew described his test: First, he mapped a local meeting. Then he posted the map on Biggerplate, on Mindjet's "Maps for That" site, and to his own Conference Reaction site. He downloaded some tool that let's people see what their sites look like to Google. And then he did a Google search for the map. Here's what he found:

  1. Google itself sees the file name. That's it.
  2. When it searches "Maps for That," it sees pretty much nothing too because of the content management system Mindjet uses (according to Andrew).
  3. Biggerplate was slightly better, showing an outline of the map contents.
  4. And when Google it searched Conference Reaction, it looked pretty much like the page he had uploaded, complete with text and the map image.


Image from Warrior Fitness

Curious Results Indeed!.
His conclusion wasn't "See what a great site I have," but "How could the results be so different? Why are they so different." He tried to correlate the search results with each site's page rank. But there didn't seem to be any clear correlation.

He then did another search using terms he thought an average person looking for a map might use: visual project management." The highest result an actual map got was the #12 result for Mindjet, but the link was to a page that wasn't exactly educational--more like a landing page for shopping. None of the mind mapping software companies in the room--and no other such vendors he could think of--were in the top 100 results.

The Challenge
The point of his presentation, as borne out by his little test, was that it seems to be very hard for the average person to stumble across an actual mind map of anything--unless they know exactly what they're looking for and probably where to find it.

And he left that as a bit of unfinished business for the companies represented at the Biggerplate conference: How can we as mind mapping experts make it easier for people to find maps online?

Thursday, March 21, 2013

Biggerplate Continued: Steve Rothwell on How to Create a Document

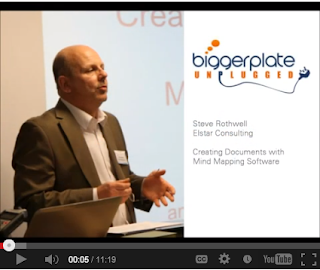
Steve Rothwell of Elstar Consulting provided a refreshing break from the previous heady presentations, guiding attendees through a methodical process of creating a document end-to-end using mind mapping.

I have to say that this is one of those things that I, as a writer, think about a great deal. I use ConceptDraw MINDMAP to think about and plan my articles, blog posts, case studies, and white papers. But I usually leave the map behind once I have a clear understanding of my structure.

I often have this nagging thought that it might be better to put more content into the map so I can have more flexibility later on. So I enjoyed Steve's clear, step-by-step description of how to do just that.

The Benefits of Using Mapping to Write
Those of us who've been around mapping for awhile have a good sense of the advantages mapping brings to writing. But Steve had a nice little list:

  1. The ability to "think visually" and literally see the connections between your thoughts
  2. The ability to easily change structure and flow using drag and drop functionality
  3. Ease of navigation, as you are able to see all your thoughts on one page rather than having to scroll
  4. And the ability to maintain focus, with your objective as the title of the map and the top-level branches a summary of your key points. Steve compares this with the common problem of getting lost in paragraphs and pages of text.

A Three-Step Process
Steve lays out his approach in three simple steps:

  1. Create Content.
  2. Prepare for Export.
  3. Export and Review.

Step 1: Create Content
For me, the first step matched pretty well with how I work. I start with brainstorming (Steve uses the brainstorming feature. Then I, as Steve called it, "sift and summarize," pulling out my key points and putting them into some kind of logical order.

But then he talks about focusing the key topics--not leaving them vague, but putting a sharp point on them. (His example: Rather than just say "Decrease distribution costs," he recommends being more specific: Decrease distribution costs by at least 7 percent." Anybody can put down some general statemen. But it may require some deeper thought and research to put up a specific number--and thought and research is good.

Another difference with my approach is that Steve recommends you start adding text. You know, full sentences, short paragraphs. Interestingly, he also suggests referring to the outline mode to get a better sense of how the article or report is developing.

Step 2: Prepare for Export
To start this section, Steve asked for a show of hands of the people who export to Word. Lots of hands went up. Then he asked how many people were satisfied with the results. I couldn't see any hands from my vantage point (watching this online).

Steve said that part of the problem is that Word styles are very hierarchical, while mind map content isn't. For example, Word styles follow a strict format of Title, Heading 1, Heading 2, Heading 3, Body Text, and so on. Some of my maps have topics that correspond to each of these layers. Some don't. And as you may know, if you export a map that has a branch with one main topic and then some more detailed copy, the detailed copy will come out as a heading. Not good.

So Steve offered three strategies to avoid this:

  1. Restructure the map so that your content conforms to a Word style.
  2. Use an app that gives you more control over Word styles.
  3. Cut and paste all of your more detailed comments into the Notes pane.

Choice #3 seemed to Steve (and to me) the best, as it produced a Word doc that looked most liked what you would expect a report or article to look like. (Obviously, you could avoid all the cutting and pasting by just writing in the Notes pane to begin with.)

Step 3: Export and Review
Once your map is structured to produce the best-looking export, then... export it (after making your dialog box choices and choosing a Word template). Steve recommends reviewing the Word doc for content, and if there are changes to be made, make them in the map, not the doc. When you're happy with the content, export the map again, add the title page, etc. and you are done.

As I say, it's not an approach I've taken. But I plan to give it a try.

Monday, March 18, 2013

January Biggerplate Event: Jim Mather on Mind Mapping & the Mainstream


(And once again, please refer to The Mindmap Blog's "Mindmapping Thought Leaders Share Best Practices in London" for each speaker's video.)

Jim Mather brings to the table a lot of experience getting people together to solve problems. Most recently, he was Scotland’s Enterprise, Energy and Tourism Minister within the Scottish Parliament in 2011.

I believe it was in that context that Jim used mind mapping to bring large groups of Scottish citizens together to make significant decisions about the future of their communities. (Jim's Biggerplate recording was cut short just as he was discussing this initiative.)

Drivers of the opportunity for widespread use of mind mapping

The gist of Jim's presentation ("Mind Mapping & the Mainstream") was, essentially, that "everything's better with mind mapping." He began by listing the drivers behind expanded use of mind mapping:

  1. Availability of mind mapping software: It's no longer a secret among those in the know. It's increasingly becoming common knowledge.
  2. Awareness of the effectiveness of a range of things that mindmapping supports:
    • Collaborative conversations
    • Systems thinking
    • Scenario planning
    • Mediation
    • Knowledge that success needs:
      • Clarity of purpose.
      • Sound operational methods.
      • Hearts, minds, and intrinsic motivation.
      • Trust.

Professor Ken Cloke's Ladder of Unity
Jim then took up on this last point, trust, by referring a Cloke's ladder of Unity. The relevance is that whenever a group of people are trying to do something together, it helps if they can "climb" this "ladder of unity." And Jim underscored the fact that mind mapping can help at every stage of this process.

The rungs in the ladder begin with:

  1. Opposition: This is the starting point, when the choice is to cooperate and move forward or to hold on to differences, opposite goals and agendas, mistrust. Once a group is able to climb past this stage, they can look for:
  2. A unifying worthy purpose: Something that will meet the overriding concerns of the entire group. Once they achieve that, they need:
  3. A Fair and Open Process: In order to achieve the ultimate goal--a plan of action arrived at through mutual trust, there must be a good process behind all activity. When there is, it naturally leads to...
  4. Relationships: As people work together and learn to like and trust each other. Out of this comes...
  5. Experience: The more people work together toward a unifying worthy purpose, following a fair and open process, then the more they experience the trust that leads to success, and the more they come to...
  6. Care about each other: And this is the key ingredient behind progress.

Names to Know
It always helpful to learn about people who are promoting the ideas upon which pro-mind mapping arguments can be made. Jim offers up a fine list.

The only person on the list I'm really familiar with is Dan Pink, who wrote "A Whole New Mind." The book talks about having symphony of mind will be a key to success in the future economy: Being able to take lots of different kinds of information and putting them all together in creative ways to solve new problems. Mind mapping is, of course, key to that. (I blogged about Pink a while ago.)
The other people on the list include:

  1. Victor Frankl
  2. Ove Arup
  3. W. Edward Demming
  4. Margaret Wheatley
  5. John Seddon
  6. Eli Goldratt
  7. Nancy Kline

The common thread among all these people, Jim says, is that mind mapping adds value to the real-world application of each of their thought systems.

Watch Jim's presentation
Jim had a lot more to say, including a case study about how he personally used mind mapping to help two Scottish communities align themselves as they planned for the future.

Jim has a lot to say based on a lot of lessons learned about using mind mapping in the real world. I encourage you to watch his presentation for yourselves. (Just don't be disappointed when the video ends abruptly.)

Friday, March 15, 2013

January Biggerplate Event: Nick Duffill on the Mismatched Expectations of Mind Mapping for Business Use


(Again, let me turn your attention to The Mindmap Blog's "Mindmapping Thought Leaders Share Best Practices in London" for each speaker's video.)

Nick Duffill: Harport Consulting
Another interesting presentation, this one from long-time friend Nick Duffill. Nick's focus was on what happens when you take mind mapping into the world of business, and he had some provocative things to say. I'll try to do them justice.

I should say before I get started that as I was taking a shower this morning it dawned on me that I should be presenting the content of these talks as mind maps. Duh! Well, I'm a writer at heart so I will just continue with good ol' text. But if anyone out there wants to take my posts on this event and represent them as maps, have at it!

Thereupon hangs a tale
But on to Nick's preso. So Nick started off with a humorous and apocryphal story about the time he was using maps to help him mange a project at a high tech company. He had created a masterful map... complex, dense, information rich, a real knowledge object... when the managing director of the company happened to walk by, notice Nick's mind map and ask what it was. "This is my big chance to introduce mind mapping into the company," Nick recalled thinking. Instead, this tech-savvy, smart director told him never to use that software in his company again.

Any club that would have me as a member...
I could hear the groan from the audience as Nick said this. But I think it's fair to say that Nick's interaction with this person either caused or confirmed an epiphany: One of the big problems with adoption mind maps have in the business world is that they are so foreign. And when some people see all of their company's proprietary information in a form they don't understand and don't know how to access--some of them understandably panic.

As Nick summed it up:

"Mind mapping creates barriers because it looks "exclusive""--in the sense that it excludes people who aren't familiar with the format.

The Remedy
The best way to make maps look less "exclusive," the best way to make them accessible and create a more welcoming environment for mapping in general, Nick says, is to "Communicate with Small Maps."

He defines maps as small not just those with few branches, but those that have been built in such a way that when the map is collapsed all the way, the central five or six branches summarize the rest of the contents of the map or state a conclusion that can be drawn from the information in the map.

And since that so rarely happens--since maps are rarely concise, it makes it hard for mindmapping to make it into the mainstream. in fact, Nick lays out 4 main reasons why maps don't synch with standard expectations for business software.

Four causes of mismatched expectations

  1. Ignorance of/lack of adherence to mind mapping "rules": All you need to make a mind map is mindmapping software. You don't need to know a thing about the art and craft of mapping. Few if any software introduce a new user to the principles of mapping. So the resulting "documents" can be undisciplined.
  2. Tree-based charts are ambiguous: Unlike pie charts or graphs, people don't know how to "read" a mind map. (To Nick's earlier point, they'd have a better chance at being able to read them if the map maker followed a few simple rules.
  3. Processes are not deliverables: Mind maps capture a process. If you are not involved in the creation of a map, the map is just a snapshot of someone else's thinking. Businesses are attuned to deliverables--something that brings with it a conclusion, a proposed action. Maps don't usually do this.
  4. Mind mapping and mind mapping software are two different things: Most mindmapping applications give users to create large maps, easily rearrange the contents, export to create other kinds of documents, create presentations, and "unfold" the map to reveal information a bit at a time... all of these great features of the applications available don't necessarily support the creation of business-oriented documents.

A proposal for maps that reflect inductive thinking
This is getting too long. But I just want to mention in brief Nick's overall conclusion. It is, if I understood him correctly, that map makers need to think in terms of inductive, rather than deductive thinking when creating maps that will be shown to others in a business environment.

To hear more from Mr. Duffill about inductive versus deductive thinking and how each are reflected in the construction of a mind map, listen to his complete presentation.

Thursday, March 14, 2013

January Biggerplate Event: Craig Scott of iThoughts


(Again, let me turn your attention to The Mindmap Blog's "Mindmapping Thought Leaders Share Best Practices in London" for each speaker's video.)

Craig Scott: iThoughts
The second speaker at the Biggerplate event was Craig Scott, founder and developer of iThoughts (http://www.ithoughts.co.uk), which develops mindmapping apps for the iPhone and "iPad" (see below).

I have to say that in this speech the sound quality is pretty bad, so I couldn't hear everything Craig had to say. I captured as much as I could.

Touchy Feely Mindmapping
His presentation started off with congratulations from Liam Hughes for having the oddest presentation title: "Touchy Feely Mindmapping." But the title makes perfect sense once you understand what he's getting at.

Craig's overall topic is how different it is to program for iPads versus laptops. (He uses "iPads" as an inclusive term for that kind of platform, whether Apple or Android. His purpose being, I imagine, to educate the mind mapping company representatives in the room about what mobile mind mapping apps need to look and behave like.

He breaks down the differences into four main categories: Physical, Demographic,Expectations, and Business Model.

  1. Physical: Craig noted some qualities that pertain to the physical nature of iPads: People tend to use them more on the go, which helps to create more of an emotional relationship between human and machine. They're always with you--like a friend. So the applications need to seem... friendly.

    But the big physical differentiator is touch, and Craig made some interesting points on this front. Touching the screen reinforces the emotional connection, causing iPad apps to be more natural, intuitive--and immersive (which, at present, doesn't seem to be a word. Oh well...)

    The interesting part of this, I thought, was how Craig described that since we are using our fingers, things have to be a lot simpler on the screen. There can't be so many choice or features, because they would be so small that our fingers would cover up our choices.

    So on the one hand, making it touch based means that the user gets far fewer options (a mouse allowing you to navigate to very small icons). But the end result is that the interface is cleaner, less scary for people who can be easily overwhelmed by too many choices.

    And the result of that is that iPad apps are simpler--which is pretty much a good thing.

  2. Demographics: Craig notes that iPads are used by lots of different kinds of people--from geeks to grandmothers (my words). This means that apps have to be approachable--and have a certain elegance to them. This is reinforced by the business model behind iPad app development, which I'll touch on in a second.
  3. Expectations: Since people do tend to have a more personal, emotional connection to iPads, the applications themselves need to reflect that by being what Craig called "delightful, simple, and beautiful." People also expect these apps to be "cheap or free." Sounds like a great market!
  4. Business Model: Craig said that the dominant business model for iPad apps is low margin, high value. That means you have to sell lots of apps. Which takes us back to #2: Demographics. With all these different kinds of people using them, the apps need to have general appeal, general ease of use, etc.

    He also noted (I think though, as I said, it was hard to hear) that apps are usually sold through an app store. He wondered aloud how the bigger mindmapping software companies would deal with having their apps sold through an app store...

The Perfect/Killer Mind Mapping App for the iPad

Finally, Craig offered what he thought would have to be some of the central attributes of the perfect mind mapping app:

  • The app must be distraction free: It must provide a clear, effortless window that gets users into using the app, not being aware of it.
  • The app must be immersive, touch-driven, something that lets you dive in and get focused on what you're doing.
  • And it must be easy to pick up and use, just like the iPad itself: Something that you can pop open on one of the iPad devices that you have around your house... in the kitchen, the den, the TV room--not just in the office.

The Future
So... interesting ideas about what mind mapping companies need to do to stay relevant in this ever-more-mobile world of smaller devices. We used to love the idea of flashing a map up on a wall so we had lots of room to think and move.

Doing this kind of thinking on an iPad screen--not to mention an iPhone screen--will certainly test the skills of mind mapping software developers worldwide, which is a good thing!

Wednesday, March 13, 2013

Did You Catch the January Biggerplate Event?

I have to admit that I completely missed this event. It was called Biggerplate Unplugged, and it came and went with me none the wiser.

What is Biggerplate?
As Biggerplate founder Liam Hughes explained in his opening remarks, his company's goal is to become THE central repository for mind maps, and to act as a sort of organizing force, connecting all the various and sundry people and companies advocating for mindmapping all around the world. We used to talk about how cool it would be to get all the top mindmapping people in one room. Hughes did it, and the results are worth paying attention to.

This morning I ran across videos from the event on The Mindmap Blog's "Mindmapping Thought Leaders Share Best Practices in London."

So what I thought I'd do is to, one at a time, summarize and comment on what these speakers had to say. (Each presentation is about 20 minutes long.) After a brief welcome by Hughes, the following people presented:

  • Chris Griffiths of ThinkBuzan
  • Craig Scott of iThoughts
  • Nick Duffill of Harport Consulting
  • Jim Mather of MindGenius
  • Steve Rothwell of Elstar Consulting
  • Andrew Wilcox of Cabre
  • John Barber of Mindjet

Chris Griffiths, ThinkBuzan

Chris kicked off his presentation with an image of Henry Ford, who once said that "thinking is the hardest work there is." Chris noted that mindmapping is all about helping people think, and that we in the mindmapping industry should be very proud of the work we do.

Simplify, Simplify...
Then he immediately began addressing one of the on-going debates among mindmappers: the interplay between focusing on the process of mapping versus the technology of mapping. He reiterated that Tony Buzan (often called the "father" of mindmapping by many), is big on process and continues to insist on the relevance of hand-drawn mind maps.

And that, Chris said, continues to be the focus of the ThinkBuzan approach. While many other mindmapping companies are making their technologies ever more complex, able to do ever more sophisticated things, Chris noted that his organization is trying to make the technology fade into the background so that the process can take its rightful place at center stage.

While Adding Layers of Complexity

But in a grand contradiction to that point of view, Chris also noted how ThinkBuzan has been working on 3D mindmapping. The impetus to do so, he said, was that 3D stimulates the brain more than 2D, and good thinking is all about stimulating the brain.

Having said that, Chris acknowledged that 3D mapping is very confusing to the brain. They have yet to crack the nut of 3D mapping.

But I thought it was pretty amazing and laudable that ThinkBuzan is trying to progress mindmapping with two such diametrical approaches.

The More the Paths, The Greater the Chance of Reaching the Destination
Chris concluded by saying that all the players in the mind mapping industry need to continue to be respectful of each other, and to pursue their own unique paths to try to advance the industry. He said that while it is absolutely amazing how many people all over the world now use mindmapping, there are millions more people to reach.

Friday, March 8, 2013

10 Tips to Running a Great Meeting, by Jean Kelley

In the February 2013 issue of Supervision magazine, Jean Kelley, author, entrepreneur, and managing director of Jean Kelley Leadership Alliance, offers ten tips for running a great meeting.

I made up this quick map. But to get the details, read the article or visit Kelley's website.

I think the one tip that I liked the most was to delegate meeting responsibility. The senior person calls and runs the meeting in most companies.

But giving someone else a chance to get up there and have a shot at it is, in my opinion, a great way to both chance meeting dynamics and do some on-the-job professional development (something far too many companies do far too little of.)

Monday, March 4, 2013

Harvard Business Review on Embracing Uncertainty

I just read a recent Harvard Business Review article about how companies like Apple, Microsoft and Nokia face the same challenges past greats like Polaroid, DEC, and Atari faced in their day: How to stay fresh.

(By the way, I access the HBR and other great magazines through something called "Business Source Premier," a free service of many public libraries. Check your local library to see if you can get in. You get pretty amazing access to top-tier business periodicals)

The point of the story, "Embracing Uncertainty," by Alan MacCormack, is that big, successful companies once known for their innovation can fall prey to identifying "best practices" and designing "standard operating procedures." As MacCormack says,

"This can make a company wildly efficient at what it does today. But it has a serious downside: an avoidance of novelty that can eat at the very soul of a company."

I love that idea of a company being "wildly efficient." But yes, the more you screw down the way you do things, the harder it might be to change. Maybe this falls into the realm of "great being the enemy of good." It's against human nature to disrupt what's working. So you better have a big incentive to make it worth people's while to go against their instincts.

Saturday, March 2, 2013

The Other Mind Mapping

I caught a newscast on Calgary TV this morning (don't you love the Internet?! :O) about a research program President Obama is planning to start in the U.S. The goal will be to examine the working of the human mind. (One can only speculate whether the current budget impasse precipitated his decision.)

The newscaster noted that the same kind of research is already taking place at the University of Calgary. The school's Brain Activity Map Project is looking for possible connections between brain function and depression.

Dr. Andrea Rotzner heads a team that's hoping to help people with depression by using the tools to predict the response to different types of treatment.

“There is research out there to suggest that people who have depression actually have a network in their brain that is responsible for mood regulation that works differently than in people who don’t have depression. So you can measure their brain signal with something called functional magnetic resonance imaging or with electroencephalography and you can show differences between the brains of people who are depressed and the brains of people who are not depressed,”
Dr. Protzner says they are hoping the research will allow them to create maps of the brain that they can then use to compare others to in order to determine an appropriate treatment for them.

There are mind maps, and then there are mind maps.

Thursday, February 28, 2013

The Life Span of a Mind Map

I've mentioned this in the past. But I continue to be fascinated by people's different interpretations of the "life span" of a mind map. (And by life span, I mean: The amount of time you actively use a given map.)

Annuals versus Perennials
Thinking about maps this way reminds me of plants. There are some plants, like... I don't know... marigolds, that people plant just to add some color to the yard, then yank them up and chuck them in the trash once their bloom is gone. Other plants, like... shrubs... represent more of an investment and usually stay where they are for years.

For some people, a mind map is as ephemeral as a marigold. They create it just to get some ideas clear in their minds, and then file it away somewhere, probably to be never used again.

For others, a map might be something they work on over a period of time, maybe to plan and even manage some kind of project or campaign.

But when the project ends, the map is once again consigned to oblivion. (Savvy map practitioners will keep these maps in a special file to help them plan another similar campaign in the future.)

And then there are maps, like the Master Map I talked about yesterday, that become a part of daily life, constantly updated to reflect the activities of the moment.

Have a Better Idea?
I personally need to find a better way to manage all of my maps. I have a tendency to create a map, put a bunch of information in it, then forget where I put it or what I called it.

Then, when I need that info I put in the map, I have no idea where to find it. (That's happening right now on one of my projects and it's really aggravating. But it is, after all, user error.)

If you have a better solution, let me know... please! :o)

Wednesday, February 27, 2013

Ode to the Master Mind Map

Like most of you, I wear a lot of hats. And it would be much harder to keep track of those hats--and which ones I needed to wear at what point in the day--and at what jaunty angle to put them (I'm tempted to continue and beat this metaphor to death, but I won't)... it would be much hard IF it weren't for my Master Map.

Perhaps like you, I have tried to find the best way to keep track of background information, contacts, history, and planning for different clients--AND what I have to do next... the unique tasks related to each client.

For a while, I tried to gather all of them up into a kind of master map. But I found that as time went on, I would just keep turning my master map into a map where I kept everything. This defeats the whole purpose of the master map because before long the map becomes so clogged with information that you lose the high-level view you wanted in the first place.

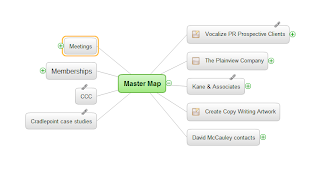
So now my master map is just a hub I can use to navigate to other maps where I do keep all of the above info, plus all my To Dos, highlighted in yellow.

This approach is helpful because it helps me keep track of how many clients I have, along with the other thing that are vital to my work: The meeting I have planned--and attended, the professional organizations I belong to, and the organizations I am actively involved in.

For me, this is the highest function of the master map. It doesn't tell me what to do today. It reminds me all the areas I'm active in, and then lets me quickly navigate to the information and immediate tasks associated with each area.

People have all kinds of tricks for managing business and personal information. MINDMAP is mine.

Tuesday, February 26, 2013

Mind Mapping Does TED

Last week, David Hill of Consolidated Edison (AKA ConEd, the company that powers Manhattan) was invited to mind map TEDx Manhattan>. I am not aware of any other TED event ever being mind mapped. I've been to some of these kinds of events where someone makes one of those hand drawn diagrams that arelater sped up and shown with the artists hand in the frame... but never before a mind map.

It's great that David was asked to do it. Among his many and assorted brilliant ideas, he created the Rebuilding Downtown Manhattan mind map after 9-1-1 that showed all of the organizations involved in the rebuild (see it on Jamie Nast's great Idea Mapping site.

It was an amazing map. So amazing, in fact, that it was acquired by the Museum of Modern Art. The museum noted that:

“We all felt that the work was of such important historical interest that we should include it in the MoMA Study Collection. The Mind Map is of particular interest to us given that we hold so much material pertaining to 9/11 and the rebuilding of lower Manhattan.”

Connecting mind mapping to TED is brilliant!

Thursday, February 21, 2013

Predictive Information Mapping

I remember the moment well. I was with some colleagues at an analyst presentation, when an IDC analyst came over and started talking to us about mind mapping. He didn't say what I expected him to say--what we have been highlighting in all of our presentations.

Instead of talking about what a great information management tool mind mapping was, he enthused instead over how each mind map creates a model of how the user's mind works. He looked forward to the day when machines would be able to map out a topic FOR someone. Based on what the machine had learned about how the individual built maps over time, it could build a map that would make perfect sense to the user.

I thought about that as I watched a video yesterday on Beet.TV about how the New York Times is doing predictive modeling of how its stories spread through the Twitterscape. (See http://www.beet.tv/2013/02/timessparktwitter.html). The Times has found or created technology that does for a group of people what mind mapping could be said to do for an individual.

If the Times's major investment in this technology in any indication (and it surely is), then it knows or has a very good idea of what kinds of people (or maybe even which individuals) read what kinds of stories--and now they know these people's other interests (what/where/how/when they eat, wear, think, travel to, etc.) so they can push out a trending story they know these people will probably read--along with an ad package designed to appeal to them.

I know news content has always been something to fill the space between ads, but the Times seems to be taking that to new heights.

Wednesday, February 20, 2013

Use the Excuse of Tax Time to Get Your Financial House in Order

I posted a while ago about using MINDMAP to make sense of your financial world... Your investments, bank accounts ,401ks...everything you own that has value.

Well, it all came home to roost for my family last year when my dear ol' dad passed away at the grand age of 89. He told us before he died that he had set aside some money for us five children... Not a lot, but something. He mentioned stock that he had accumulated over 39 years at the same company. All he said was that the stock had done pretty well. (He told us what the stock was. I just don't want to divulge that.)

But it has taken our attorney months and months to figure out dad's entire financial picture. This has probably cost us a small fortune in extra legal expenses, and it has delayed the whole process of distributing his wealth.

None of us kids are mad about any of this. We were very surprised he had been able to put anything at all aside. And we all just kind of laugh--how like dad this was to be a little loosely goosed on the details.

But it is/was all so unnecessary. Now that tax time approaches, now that you have to review where all your wealth is, open up MINDMAP and just jot down all the different places you have money. You'll feel more comfortable knowing that, god forbid you were to pass on tomorrow, your affairs would be in order.

Wednesday, February 13, 2013

Marketing Planning & MINDMAP

I had the pleasure of interviewing Amanda Larrinaga, a really good marketer from Boise who, sadly, has moved to Montana. Not only is she good at what she does (especially in terms of helping companies do social media using advanced visual aesthetics), but she devotes a lot of time and energy to staying current with and embracing new technology.

Before I get into Amanda's comments on how she uses MINDMAP, here's her map (made for a photographer here in Boise):

If You Don't Think Like Other People, Rejoice...But Find a Common Language
Amanda talks about the struggle some creative people have of taking what's in their heads and making it understandable to others.

“When I’m planning a project—whether it’s for my own business or for a client—there are always lots of moving pieces and parts, I need to communicate a lot of detail. But I have to do it in a way that won’t overwhelm people.”

Part of the reason it doesn't overwhelm people, she says, is that you can control what the staff member or client sees:

“It’s so easy for people to get overwhelmed with information. MINDMAP allows you to show it to them one piece at a time—moving on only when you’re sure they understand the piece before them.”

Clients Got Attention Deficit Disorder?
And I liked her description of how MINDMAP can help you manage clients--many of whom seem to have ADD when it comes to following along with a presentation:

“Sometimes we’ll be talking about one aspect of a marketing plan when the client suddenly starts to fixate on something else. The map structure lets me jump instantly to that part of the plan they want to discuss. Sometimes they just want to make sure we’ve dealt with something that has just popped into their heads."

"I could assure them with words that we’re going to talk about, say, pamphlets. But it’s much more assuring if I can open up the part of the map that talks about brochures and let them see for themselves.”

And she says that when she does jump to another part, it’s very easy for her to change content on the fly to reflect changes in she and/or the client’s thinking.

Tired of Pulling Teeth?

...now that I use mind maps, I never have to push for questions. I get them right away.

One thing she mentioned really struck home for me because I've seen it so many times:

“Even if I’m really probing for questions and trying to really create a conversation, it can just be really frustrating. And as a business owner, it can be a little stressful when the client seems to have nothing to say—because I know they’re usually stewing about something. But now that I use mind maps, I never have to push for questions. I get them right away.”

I remember interviewing someone at Hewlett Packard who told me how, when she used mind mapping with people from another country who were not native English speakers, the rates of participation were always high.

Words of Wisdom from a Self-Confessed TechnoGeek
But probably the coolest thing Amanda said comes from the fact that one of the things she's passionate about is helping her clients find tools that are easy to learn and help them do what they do.

“A big part of my business is making recommendations around implementing different technologies or processes. I pay attention to user friendliness and how intuitive something is. I’ve found that while there is always a range of people’s skill sets, ConceptDraw MINDMAP is one tool that I always recommend, no matter someone’s background.”

Thanks, Amanda!